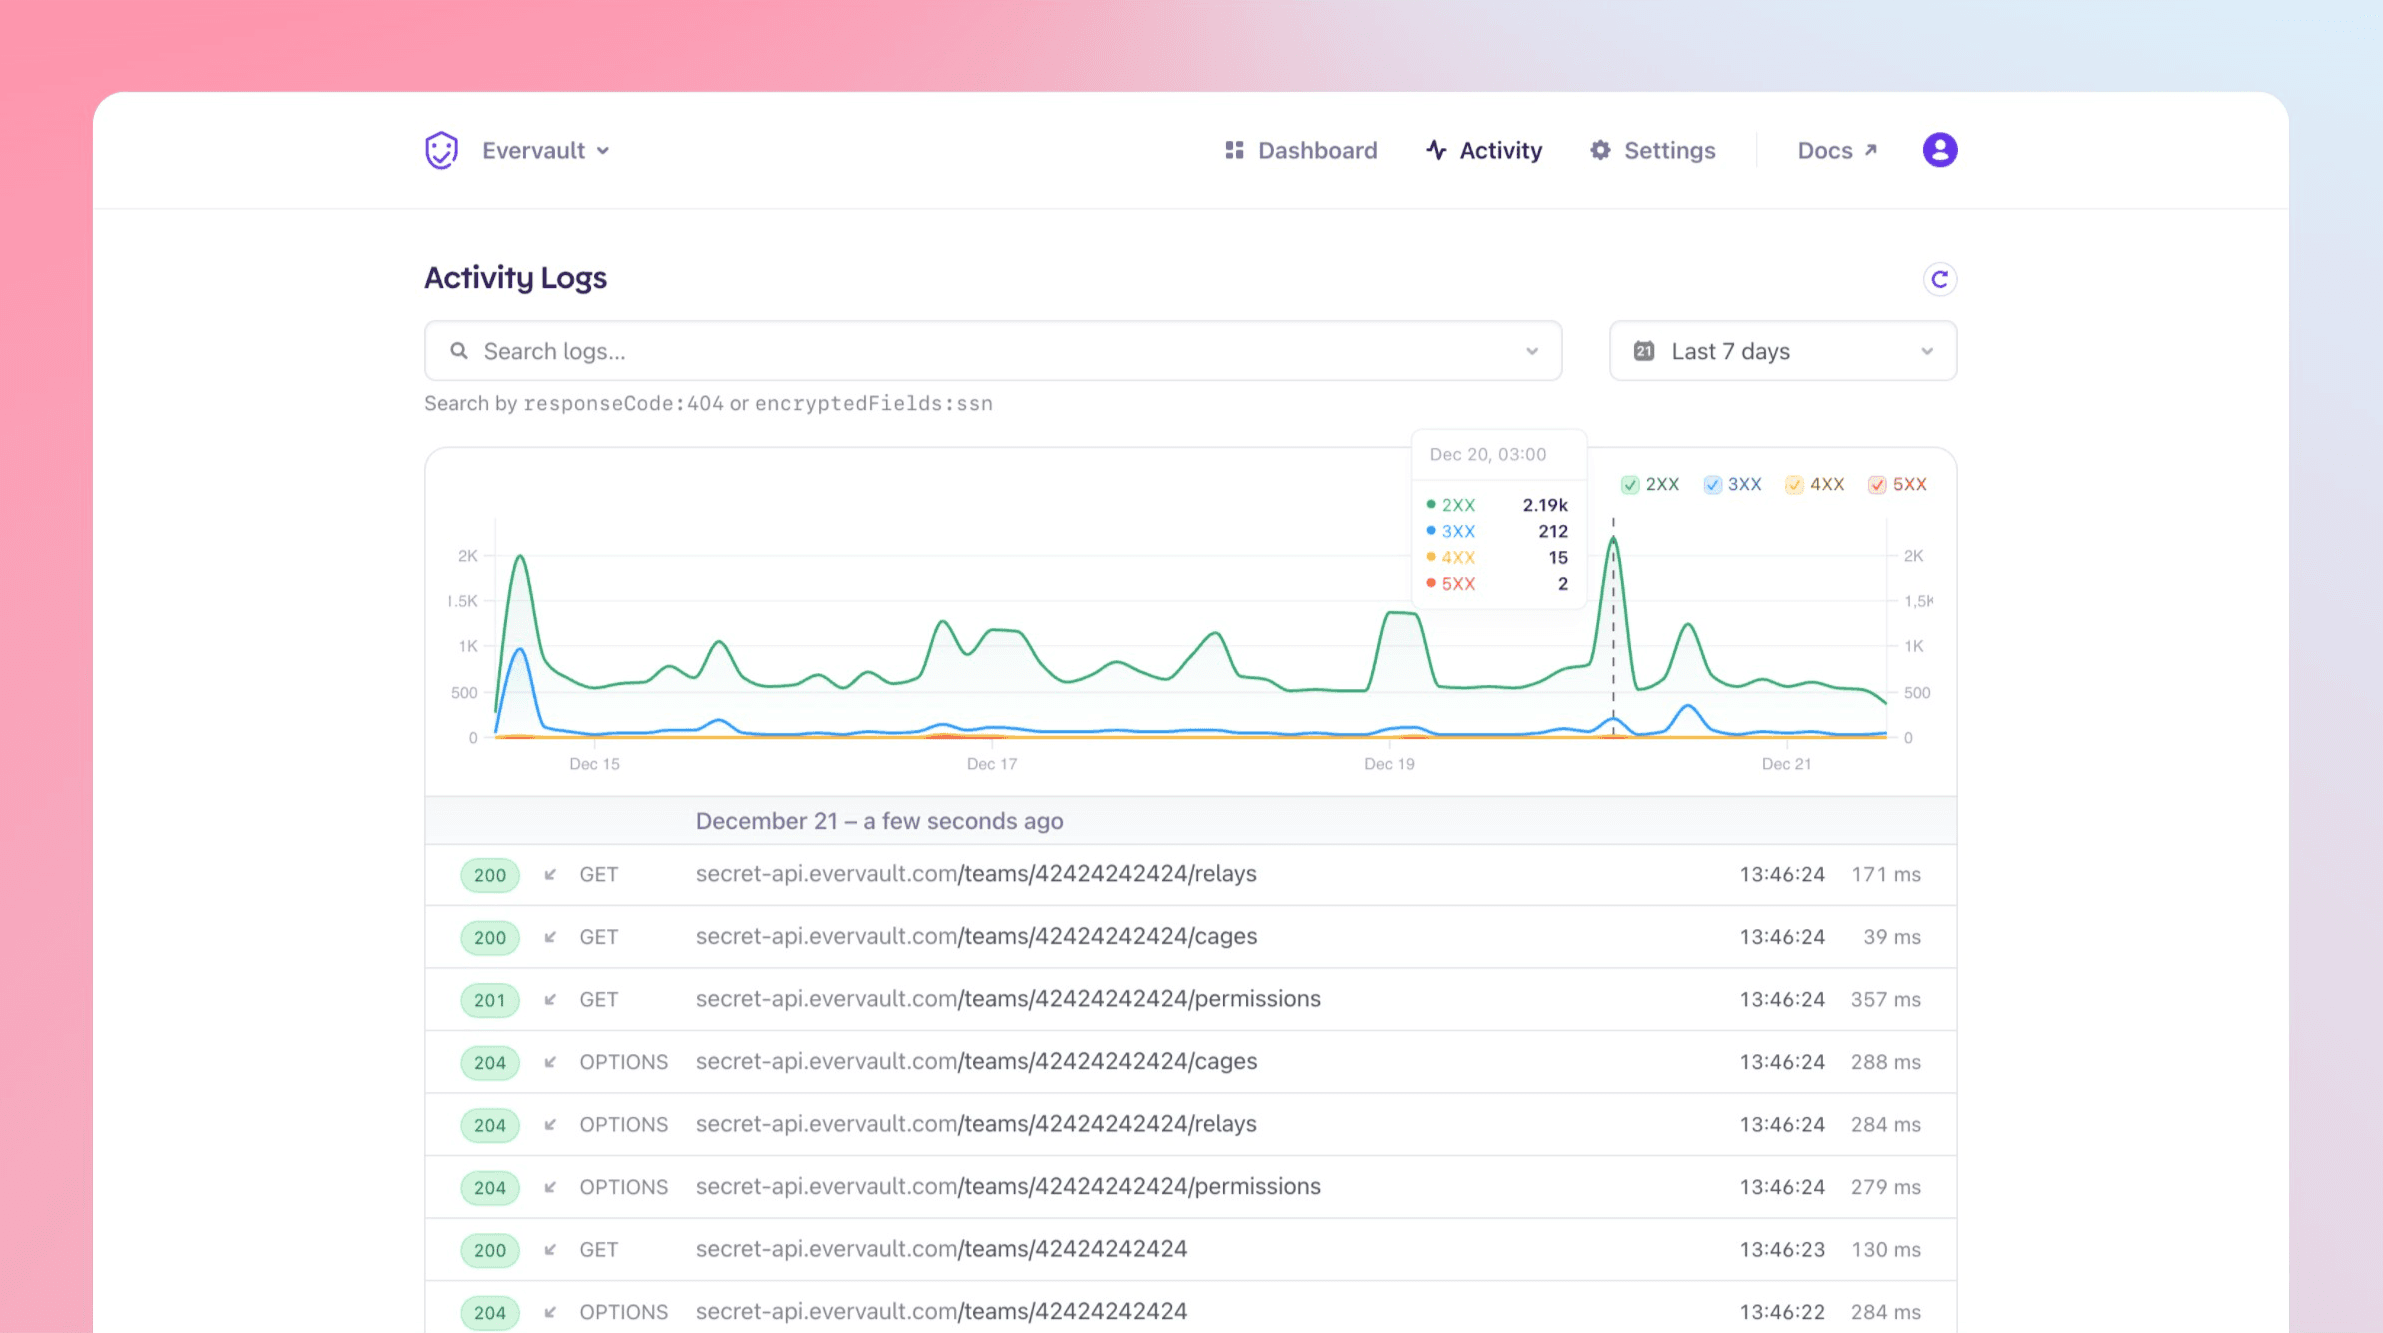
We are happy to announce charting for Relay requests. The goal is to help make traffic data more digestible, so it’s easier to monitor trends over time, see spikes in traffic, and identify any possible bottlenecks.
With the new charting capabilities, users are also able to filter by HTTP code (e.g. 2XX, 3XX, 4XX, 5XX) or any search term — because when you filter for logs the chart is also updated to reflect your search.
This is the first of a series of improvements we are making to help users better understand traffic behaviour, and get better insights from their data. Stay tuned!